Plotting New York Airbnb listings

Question

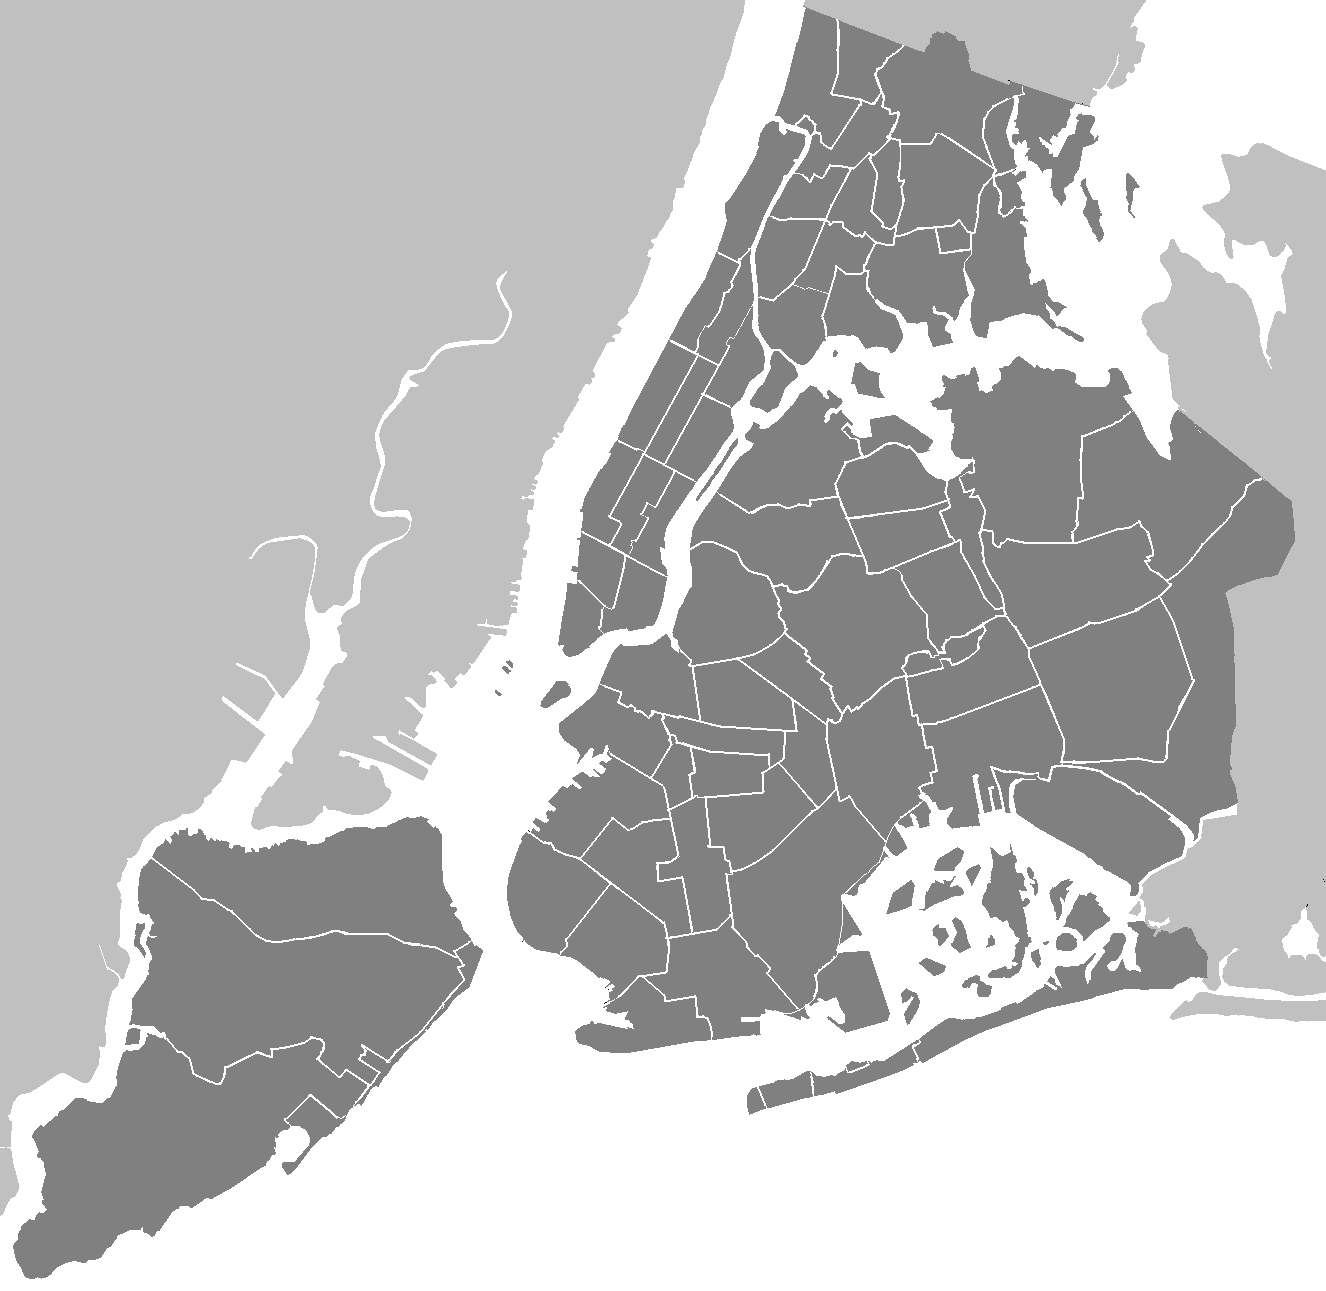
Can you use this map and this dataset to plot Airbnb listings across New York City by price?

The dataset include the following fields:

  • id: id of the listing
  • name: Name of listing
  • host_id: ID of the host
  • host_name: Name of the host
  • neighbourhood_group: general location of listing
  • neighbourhood: granular location of listing
  • latitude: latitude coordinates of listing
  • longitude: longitude coordinates of listing
  • room_type: type of room for the listing
  • price: price per night for listing
  • minimum_nights: minimum nights required to stay
  • number_of_reviews: number of reviews
  • last_review: date of last review
  • reviews_per_month: number of reviews per month
  • calculated_host_listings_count: number of listings under the host
  • availability_365: number of days the listing is available throughout the year.

Here are a few tips to help get you started:

  • Latitudes and longitudes are included in the dataset, and can be used to create a scatter plot
  • Consider segmenting the data in order to clearly see the price ranges. For example, if the price range for the set is between 100.00 and 10,000.000, but 90% of listings fall under the 500.00 price range, you might want to cap our plot to only showing prices under 500.00
  • You will also only want to include sites that have more than 30 days available to book a year and have at least 1 review

The code below loads in the dataset and a few relevant python libraries. You can also make a copy of this Colab Notebook.

# Importing packages
import numpy as np
import pandas as pd
%matplotlib inline
import seaborn as sns

# Need this to import map image and create chart
import urllib
import matplotlib.pyplot as plt
import matplotlib.image as mpimg
# Reading in data
df = pd.read_csv('https://raw.githubusercontent.com/erood/interviewqs.com_code_snippets/master/Datasets/AB_NYC_2019.csv', parse_dates=True) 
df.head()
id name host_id host_name neighbourhood_group neighbourhood latitude
0 2539 Clean & quiet apt home by the park 2787 John Brooklyn Kensington 40.64749
1 2595 Skylit Midtown Castle 2845 Jennifer Manhattan Midtown 40.75362
2 3647 THE VILLAGE OF HARLEM....NEW YORK ! 4632 Elisabeth Manhattan Harlem 40.80902
3 3831 Cozy Entire Floor of Brownstone 4869 LisaRoxanne Brooklyn Clinton Hill 40.68514
4 5022 Entire Apt: Spacious Studio/Loft by central park 7192 Laura Manhattan East Harlem 40.79851

Getting started with the map image

# Code to get you started with the image

# Setting the figure size
plt.figure(figsize=(10,8))

# Loading NYC image provide in question prompt
i=urllib.request.urlopen('https://raw.githubusercontent.com/erood/interviewqs.com_code_snippets/master/Datasets/Neighbourhoods_New_York_City_Map.png')
nyc_img=plt.imread(i)

# Scaling image based on latitude and longitude min and max for correct output
plt.imshow(nyc_img,zorder=0,extent=[-74.258, -73.7, 40.49,40.92])
ax=plt.gca()

# Plotting our data points on top of the image
### You'll need to insert your own code here #####

Solution

Access restricted

Subscribe to premium account to see the solution.

Get premium now