US Counties with the Highest Annual Savings Potential
Explore which US counties offer the highest potential for savings by comparing median income to minimum cost of living. Includes interactive charts and raw data sources.
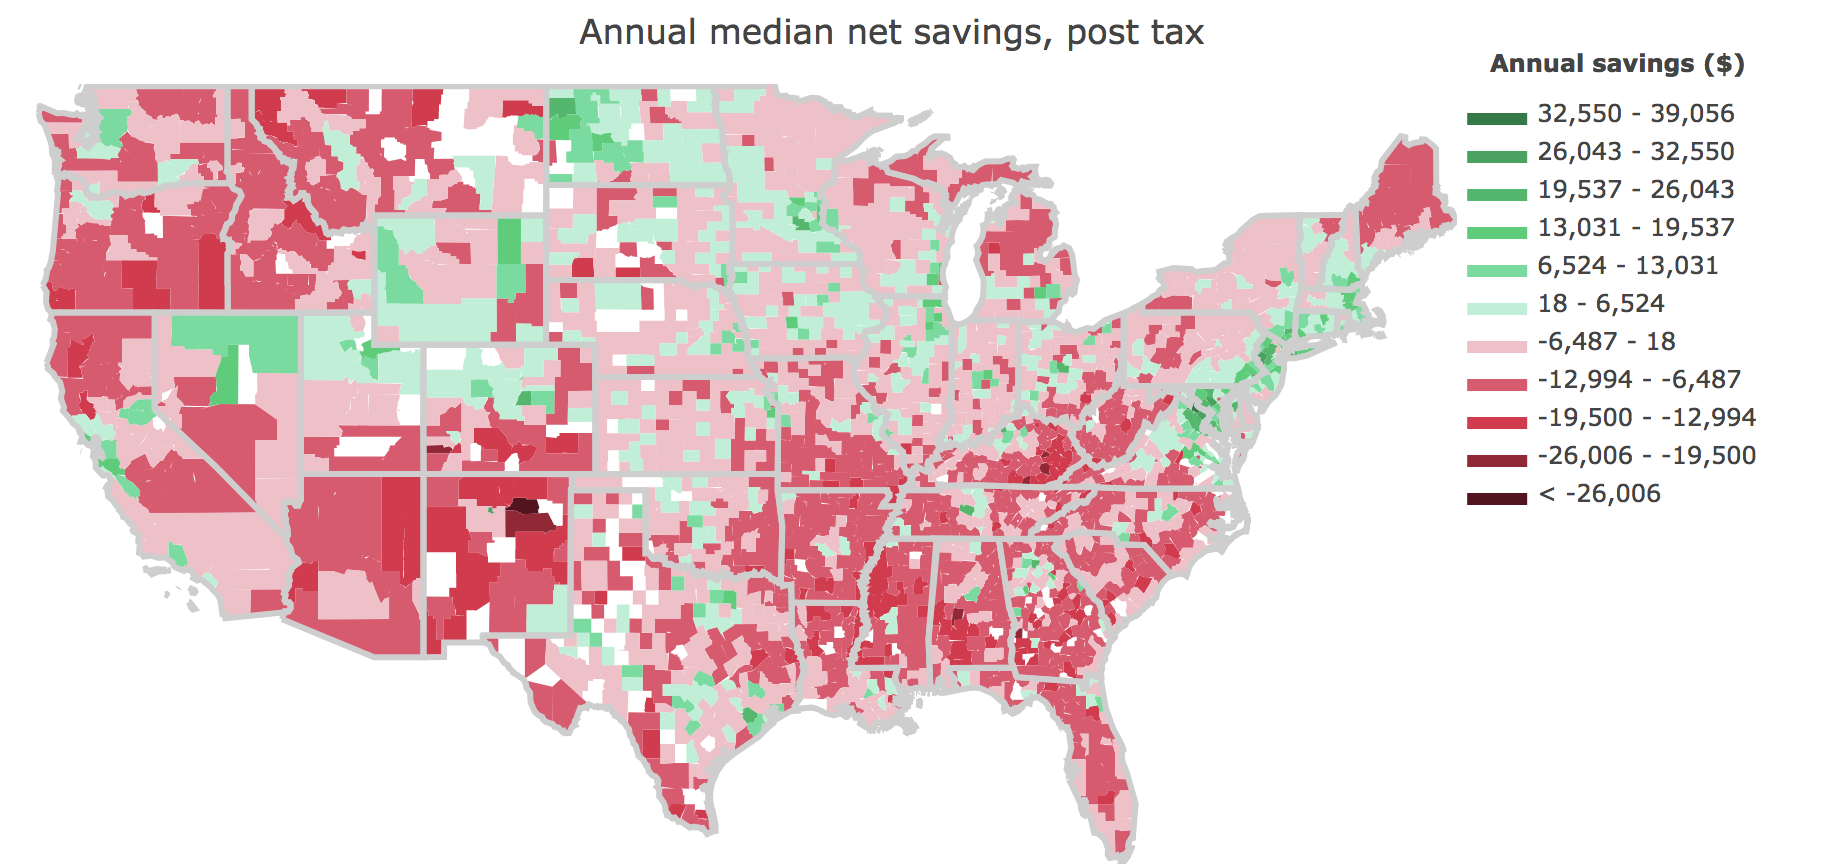
I was curious which areas of the U.S. afforded folks the highest 'savings potential', defined for our purposes as [median income - 'minimum' cost of living], so I gathered the data and created the below map, detailing savings potential by U.S. county.
Want to see an interactive version? Click here.
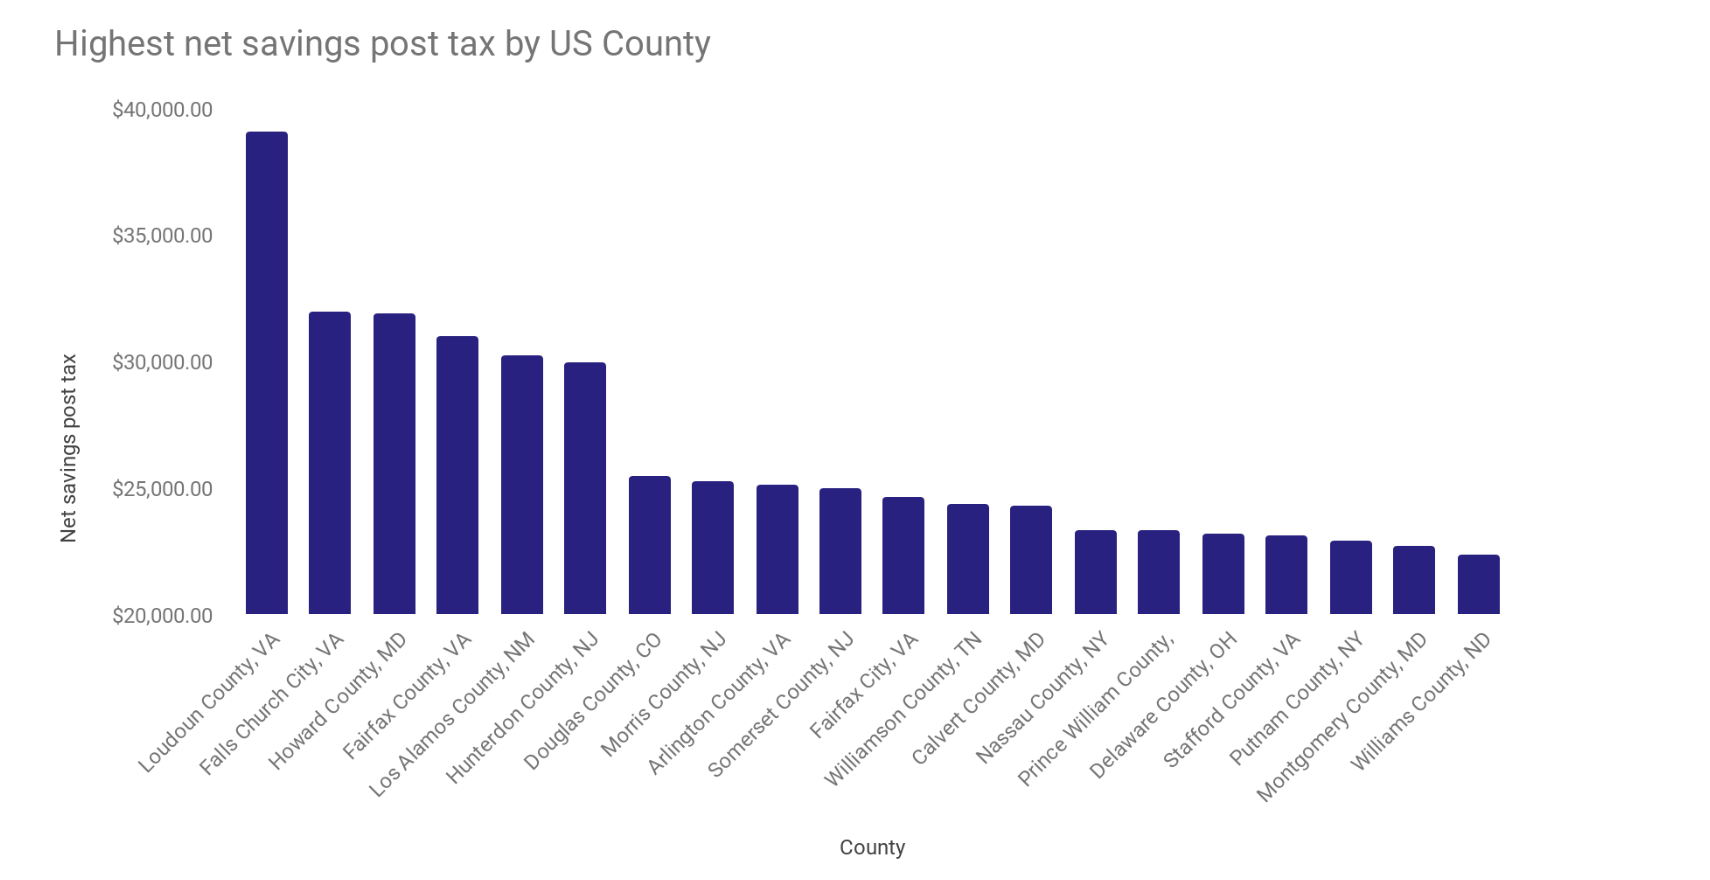
Which counties offer the highest savings potential?
The chart below shows the top 20 counties in the U.S. with the highest savings potential.
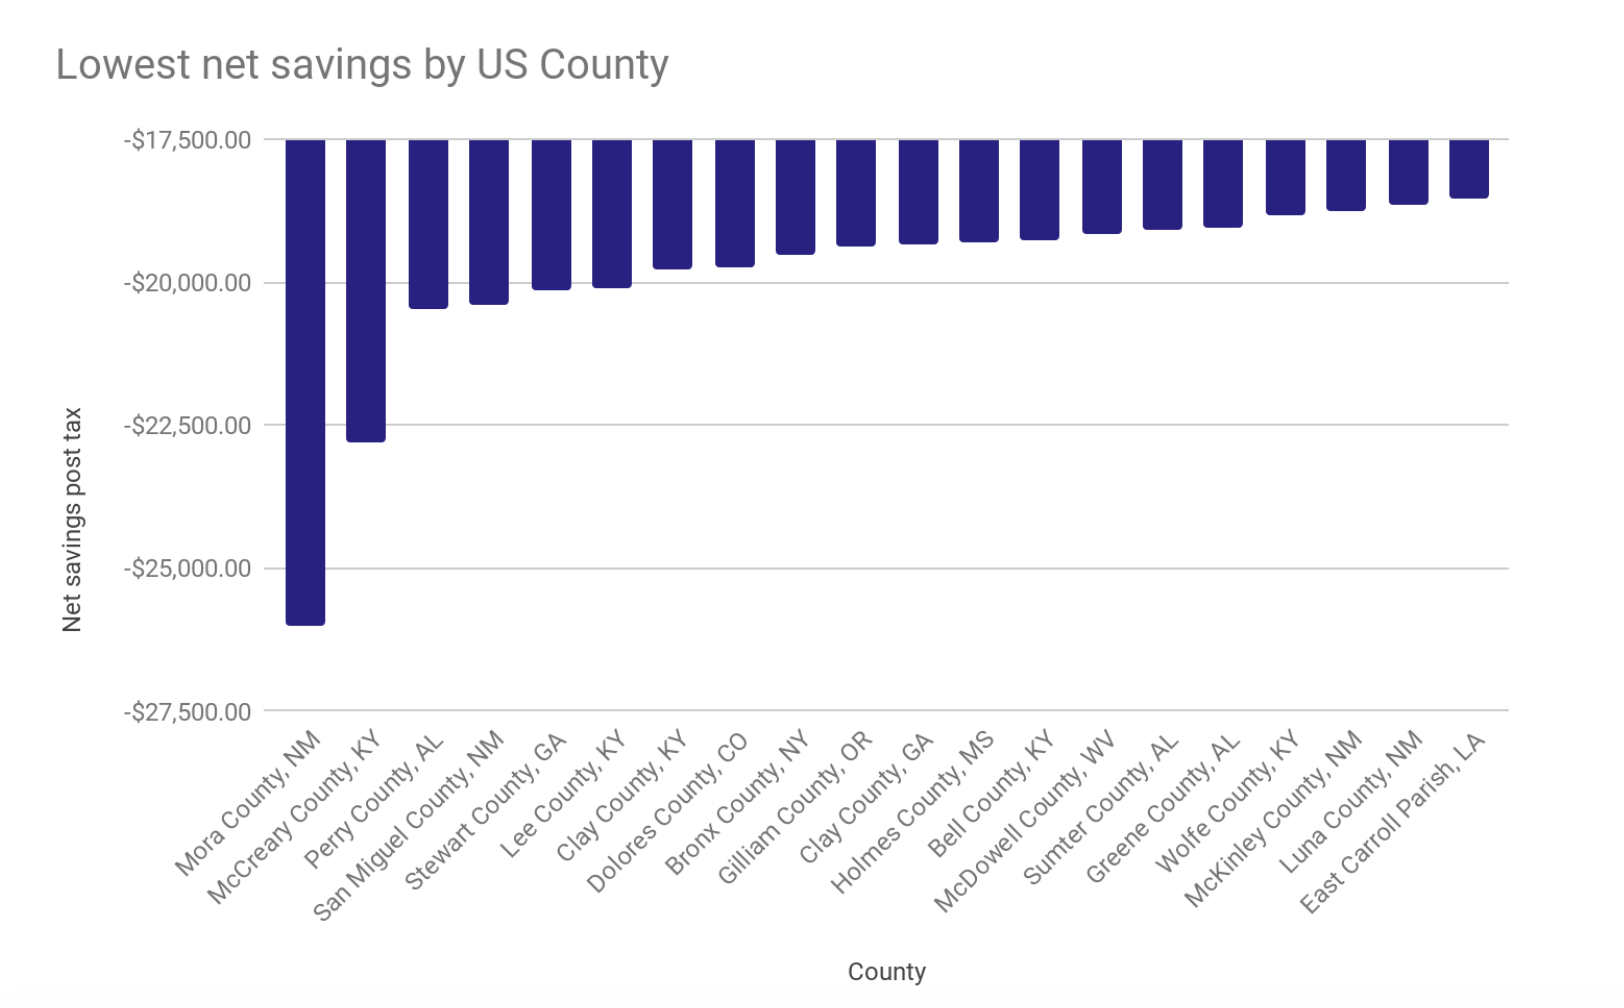
Which counties have the lowest savings potential?
The chart below shows the 20 counties in the US with lowest median annual savings. In other words, these counties have low median income relative to their high cost of living.
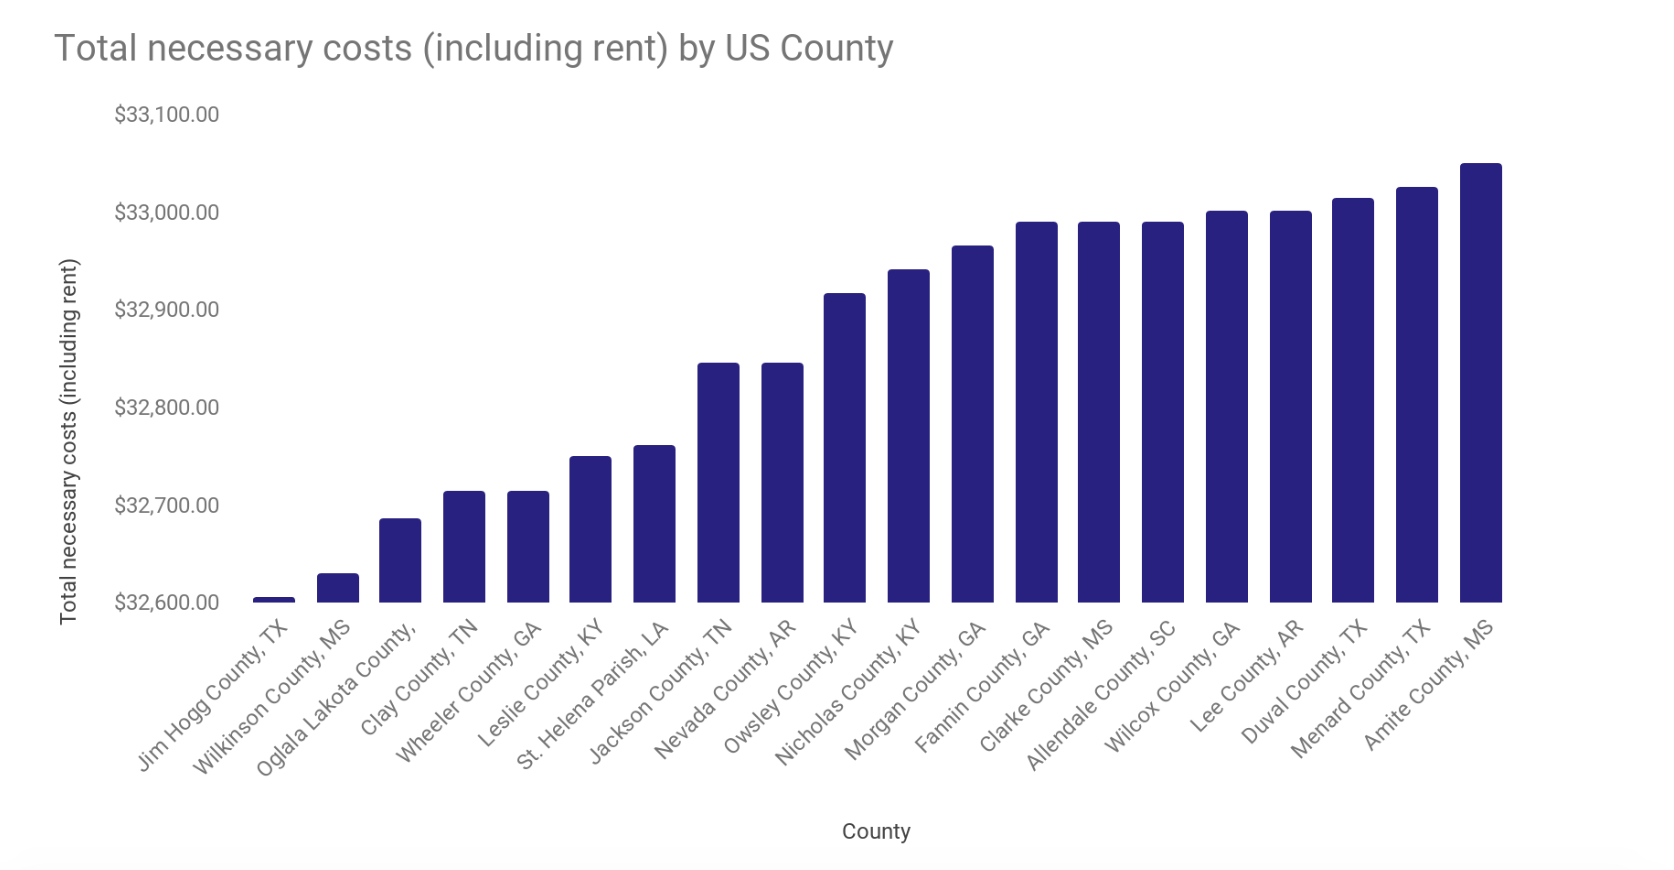
Where should I live to mimize costs? (regardless of income)
The chart below shows the 20 counties offering the lowest potential cost of living. Rent is the primary driver for these counties' low COL, as the other costs are ~similar across regions. For example, to rent a 1 bedroom in Jim Hogg County, TX it will run you an avg. of ~$188 per month. If Texas isn't your scene, don't worry -- there are ~200 counties in the U.S. that all offer 1 bedroom rent for less than $300/month. Take a dive into the raw data here.
As you can see from the charts above there are a large amount of places where it's difficult to save money, so it isn't particularly surprising that 40% of Americans can't cover a $400 emergency expense.
h3(style="color:#4b2cde") Calculations/data:
Calculating 'savings potential'
I calculated median income post tax and subtracted by the total “minimum” costs of living. Below I outline how I calculated each input to create the chart above. Raw calculations and data are in this Google Sheet.
Income I was able to find median income per household by US county (you can find the data in the "Sources and raw data" section below. I then reduce the median income per household by the average US tax rate of (~31.5%). This value provides me the median income post tax.
Rent One of the largest costs that vary by region is rent, which I was lucky enough to have found the data of median rent per US county. For this exercise, we’re assuming median rent for a 1 bedroom apartment (in order to have consistency across all regions, (e.g. comparing a 1 bedroom to a 2 bedroom wouldn't be fair because a 2 bedroom costs more). Plus, if you're really trying to save, you'll minimize the amount of space you are paying for.
Costs associated with living The next cost I factored in was the average cost of living per region across the US (e.g. West, Midwest, South, and Northeast). Unfortunately, I was not able to get cost of living at the county level. The costs of living value take into account average costs for food, alcohol, utilities, supplies, clothing, transportation, healthcare, and entertainment. However, for my calculation, I reduced cost of food, utilities + supplies + equipment, and transportation by 20%, and I completely removed entertainment, clothing, and alcohol. If you’re really trying to save, you would try to be frugal in these areas.
Sources and raw data
I used this website and used data sets B25031 (rent) and S1901 (income). To get cost of living I used this website. You can see all the raw data here.